Phase 1 – North River Farms Restoration
Non-riverine wet hardwood forest wetland restoration
Following an initial site survey and identification of a reference wetland it was determined that the target wetland community for the first phase of restoration (100 ha (250 acre)) would be non-riverine wet hardwood forest. Soils at the site were mostly Deloss, with pockets of Wasda muck and Leon sand. The restoration design was geared towards not only achieving a successful restoration that would increase wetland habitat, hydrologic function, and improve local water quality, but included a research component that would lead to improved future wetland restorations. The primary research goals for this project included:
- Determine the influence of surface conditions on achieving target wetland hydrology and soil conditions
- Evaluate survival of trees planted within the restoration without fertilization and herbicide application
- Determine the water quality improvement of outflow from the wetland during the first three years following restoration
During the first phase of the restoration project (completed in March 2003), 100 ha (250 acres) of prior converted cropland non-riparian hardwood wetland were restored by plugging existing field ditches, utilizing three distinct soil surface construction techniques(to be discussed in more detail later), and installation of 9 flashboard risers to control water table level and outflow. Wetland features such as open water areas and simulated tree falls were also added across the site in regular intervals to increase topographic diversity (Figure 1).
The construction was completed in approximately 4 months and the site was planted with native wetland trees such as oaks (Quercus spp.), water tupelo and black gum (Nyssa aquatic and Nyssa sylvatica), bald cypress (Taxodium disticum), atlantic white cedar (Chamaecyparis thyoides), green ash (Fraxinus pennsylvanica), and longleaf pines (Pinus palustris) on the sandier soils. Over 89,000 trees were planted at the site.
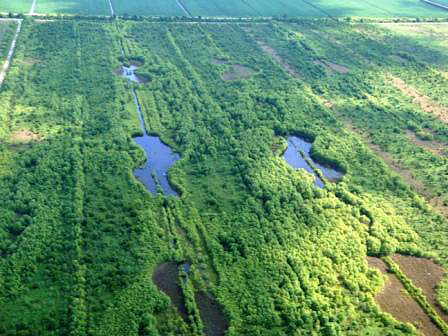
Hydrologic Response of Three Different Wetland Restoration Techniques
Introduction
The goal of this study was to determine the degree of surface manipulation which is required during restoration construction to achieve desire wetland hydrology and surface wetness. Increased surface manipulation results in increased construction cost and should result in wetter conditions. The ultimate goal is not to create the wettest site but to match the conditions found in eastern NC reference wetlands.
Two separate studies have been conducted at the site by Wright (2005) and Jarzemsky (2009). Plots for the three different surface construction techniques were implemented in triplicate. Ditches in the fields were plugged and the surface construction techniques studied were:
- None (therefore maintaining the smooth surface and field crowns common in crop production)
- Surface roughening (roughened surface providing increased surface storage)
- Crown removal (lowered elevation by field crown removal and topsoil replaced).
The hydrology of the treatment plots as well as a reference wetland (Figure 2b) was monitored form 2003 – 2008. During this period the site experienced a wide range of climatic and hydrologic conditions. The site experience annual rainfalls both much higher and lower than long term averages.
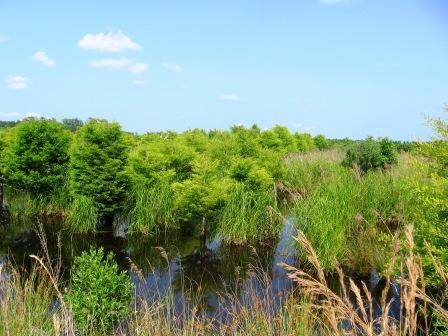 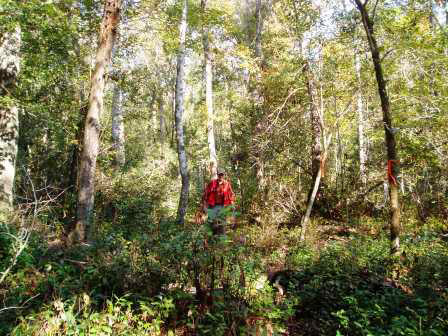 |
| Figure 2 a. (left). Restored wetlands at North River Farms. Figure 2 b (right). Reference Wetland. |
Results
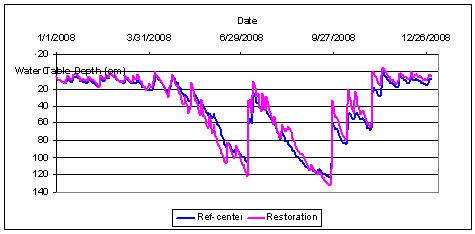
Hydrology of the reference and restoration site was typical of eastern NC wetlands that are precipitation driven. Water table elevations were generally the highest during the winter or following tropical events, and the lowest during the mid to late summer months. Figure 3, the mean water table profile for the entire restoration and the center wells of the reference wetland from 2008, shows this phenomenon.
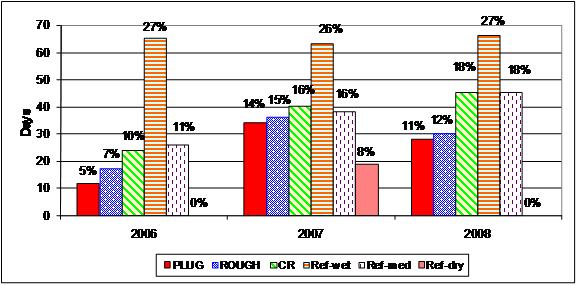
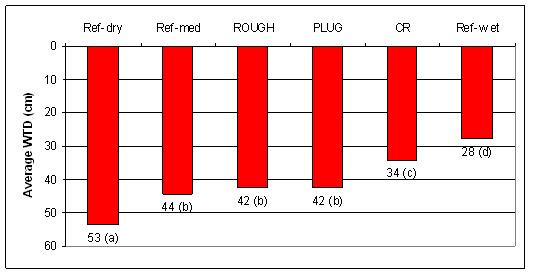
In addition to groundwater hydrology, surface outflow was also evaluated for the treatments. Based on the observations that the CR treatment produced the wettest conditions of all of the wetland restoration areas, it was not surprising that it also produced significantly less total outflow during the 2003-2004 and 2006-2008 periods. Figure 6 shows that data during the 2006-2008 period.
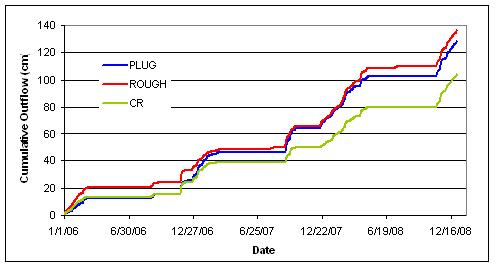
It was originally hypothesized that the PLUG treatment would have the greatest outflow, while there would be significantly reduced outflow in the ROUGH and CR treatments, but there would be little difference between them. However, the ROUGH treatment contributed significantly more outflow during the study than did the CR treatment. This difference on average was about 10 cm (4 in) per year. Surveying conducted in 2006 revealed that some surface water conveyance paths may have been created during the roughening process. Since the crown was not removed in the ROUGH treatments, surface flow through these conveyances towards the outlet may have been enhanced.
Conclusions and Recommendations
The restored non-riverine wet hardwood wetland clearly met minimum USACE wetland jurisdictional criteria (water table within 30 cm [12 in] continuously for 5% of the growing season) for all wetland treatments evaluated.
The crown removal (CR) restoration technique resulted in the wettest groundwater condition and least outflow; however it may have created conditions wetter than the reference wetland.
Hydrologic criteria evaluated for the surface roughening treatments (ROUGH) yielded results most similar to the median values obtained in the reference wetland. However, the most water was exported from this treatment, likely due to surface flow conveyances that developed due to surface grading during construction.
Surface roughening is recommended for all restorations to maximize surface storage, create habitat diversity similar to natural wetlands, and enhance biogeochemical conditions (i.e low redox potential) within the soils.
Surface roughening techniques should employ methods where the creation of surface water conveyances to the outlets are minimized, in order to minimize outflow from the wetland.
If field crowns are excessively high or if soils appear to have minimal historical wetness then crown removal is recommended to help ensure the meeting of target hydrology and maximize restoration success.
Water Quality Improvements from Large-Scale Wetland Restoration in Eastern North Carolina
Introduction
Agriculture has been identified as the largest contributor of pollutants causing impairment of North Carolina streams and estuaries (NCDWQ, 1996). Water from nutrient rich agricultural land is quickly drained to the state’s rivers and estuaries potentially causing eutrophication. The drainage canal that transports the water from the restored North River wetlands and other nearby agricultural lands has estimated flows of over 23,000,000 m3/year (810,000,000 ft3/year). With an average total nitrogen concentration of 2.7 mg/L from three years of data, this results in an estimate of 63,000 kg (140,000 lbs) of nitrogen being added to the North River every year. The average total phosphorus concentration in the canal is 0.43 mg/L resulting in an estimated export of 10,000 kg (22,000 lbs) of phosphorus from this drainage canal every year. This illustrates the amount of nutrients coming from one sub-watershed. Wetland restoration can contribute to the reduction of nutrient loads to nearby estuaries in three ways:
- Reduce nutrient concentration
- Reduce water outflow
- Reduction in both nutrient concentration and outflow
Water Quality Objectives:
- Evaluate restoration techniques designed for ideal wetland hydrology to determine if there is also an improvement in water quality compared to agricultural drainage
- Reduce nutrient loads to North River
- Reduce drainage water outflow volumes
- Quantify improvements in nutrient loads as a result of restoration of a prior converted agricultural site
Materials and Methods
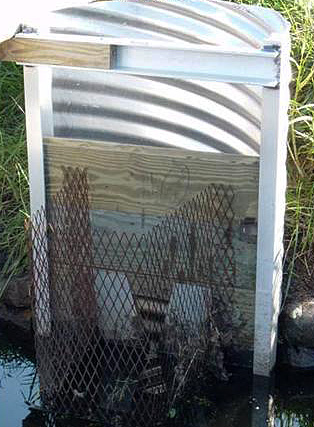
Water control structures (Figure 7) were installed in the existing drainage ditches to provide control of water levels within the wetlands and a means of monitoring outflow. Berms were constructed between the treatments to minimize surface water flow between them. Stage was monitored and logged at each of the water control structures using a float-pulley water level datalogger. The water stage along with a v-notch weir in the structure allowed outflow from the wetlands to be determined.
Water quality grab samples were collected from the control structures during outflow events in the restored wetland area. Samples were collected automatically daily and composited weekly from a nearby drainage agricultural drainage canal and near the outlet of the reference wetland. These samples were analyzed for total phosphorus (TP), nitrate (NO3-N) and total kjehldahl nitrogen (TKN). The sum NO3-N and TKN was used to determine total nitrogen (TN).
Results and Discussion
Nitrogen Concentration
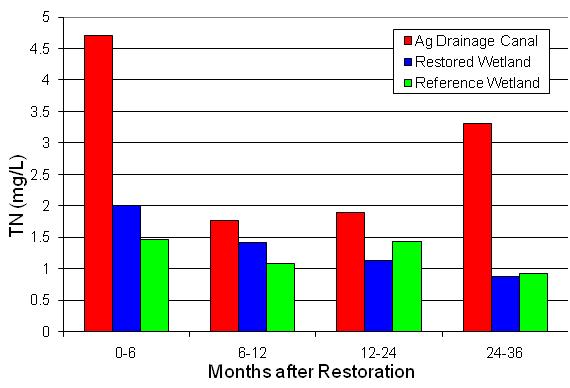
Water quality samples were collected and analyzed for the period from April 2003-March 2006. For the entire monitoring period, total nitrogen (TN) concentrations were significantly less in the restored wetlands than in the nearby agricultural drainage canal. For the period 2003-2006, TN concentrations differed between the ROUGH and CR treatments, with the ROUGH wetland areas exhibiting the lowest outflow concentrations. The PLUG treatment was not significantly different from the two other treatments. The concentrations in the restored wetlands reached levels similar to that measured in the reference wetland 12 months after the restoration was completed (Figure 8). In the third year of monitoring (April 2005 to March 2006) the export concentrations were similar for all of the treatments and the reference wetland. The drainage canal concentrations were significantly different than those of the reference wetland and the treatments. Reductions in nitrogen concentrations in the restored wetlands are attributed to cessation of fertilizer application to the restored area, wetland biogeochemical processes such as denitrification, and plant uptake.
Nitrogen Export
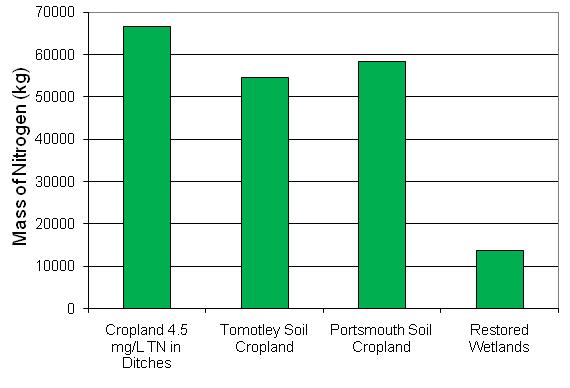
Using water quality analysis and flow data from three years of monitoring the nitrogen export from the research plots was calculated and averaged. It is estimated that the overall restoration will export 14,000 kg (31,000 lb) of nitrogen over 30 years based on the three years of collected data.
To estimate the nutrient savings due to the wetland restoration, pre-restoration nitrogen exports had to be estimated. Post-restoration data was available for flows and pre-restoration flows were estimated for the restoration area using the hydrologic model DRAINMOD (Wright, 2005).
Using an intermediate nitrogen concentration found in agricultural drainage ditches in Eastern North Carolina (Osmond et al., 2003) and the estimated pre-restoration flows, it was estimated that 39 hectares (96 acres) of farmland would contribute over 65,000 kg (143,000 lb) of nitrogen to the North River over 30 years of agricultural use.
Other research conducted on agricultural land in Eastern North Carolina had estimated the loss of nitrogen per unit of area (Deal et al., 1986). Using soils similar to the Deloss soil found in the restored wetland area, pre-restoration exports were estimated between 54,000 and 59,000 kg (119,000 – 130,000 lb) over 30 years (Figure 9). This shows a minimum 40,000 kg (88,000 lb) reduction in nitrogen exported over 30 years due to the restoration of 39 hectares of wetlands.
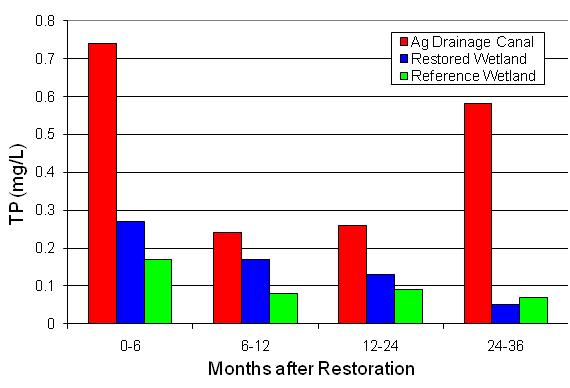
Total phosphorus (TP) concentrations leaving the restored wetlands were significantly lower than the concentrations in the agriculture drainage canal throughout the three years of monitoring. The ROUGH treatment had the lowest phosphorus concentration and the CR had the highest concentration. The PLUG treatment was not significantly different from the crown removal treatment. The concentrations leaving the restored wetlands reached levels similar to those leaving the reference wetland after the first year as shown in Figure 10. In the last year of monitoring there was not a significant difference in the total phosphorus concentration of the treatments and the reference wetland. The concentration in the agriculture drainage canal continued to be different than the restored or reference wetlands. The reduction in phosphorus concentration can be attributed to ending the application of fertilizer and utilization by plants.
Conclusions
Wetland restoration using any of the three techniques was effective at lowering the nitrogen loading compared to that of agricultural land. Through reducing the concentration of nitrogen and the volume of outflow, the total mass of nitrogen was reduced. With the phosphorus concentrations reaching levels similar to those leaving the reference wetland, the mass of phosphorus being exported from the land is less than when the land was in agricultural production. Wetland restoration and the resultant nutrient load reduction in key areas has the potential to benefit coastal estuaries.
References
Deal, S.C., J.W. Gilliam, R.W. Skaggs, and K. D. Konyha. 1986. Prediction of nitrogen and phosphorous losses as related agricultural drainage system design. Agriculture, Ecosystems, and Environment 18:37-51.
North Carolina Division of Water Quality (NCDWQ). 1996. Water quality progress in North Carolina 1994–1995 305(b) Report. Report No. 96-03, Raleigh, N.C.
Osmond, D.L., J.W. Gilliam and R.O. Evans. 2002. Riparian Buffers and Controlled Drainage to Reduce Agricultural Nonpoint Source Pollution, North Carolina Agricultural Research Service Technical Bulletin 318, North Carolina State University, Raleigh, NC.
Wright, J.D. 2005. The evaluation and modeling of the effects of surface treatments of a restored wetland in the Coastal Plain of North Carolina. Published Masters Thesis. Raleigh, NC. North Carolina State University. Department of Biological and Agricultural Engineering.
